An article written by Dr Edward Leatham, Consultant Cardiologist © 2025 E.Leatham
For busy people, or to tune in when on the move, Google Notebook AI audio podcast and an explainer slide show are available for this story beneath.
Why “Normal” HbA1c No Longer Tells the Full Story
There is a worrying increase in incidence of Type 2 Diabetes globally, linked to obesity, ultra-processed foods with sugar hidden in food and relatively sedentary lifestyles. Type 2 diabetes is a major risk factor for developing cardiovascular diseases including coronary heart disease, heart failure, renal failure, stroke and dementia, so ideally, cardiologists and any cardiovascular prevention programme need to address and correct any signs of glucose and insulin issues, as early as possible.
For decades, most people have been reassured that if their HbA1c is normal, their glucose control is fine. But in modern clinical practice, that assumption is rapidly falling apart. We now see many people with completely normal HbA1c who are unknowingly riding daily glucose rollercoasters — spikes, dips, swings, and long stretches of elevated glucose that standard blood tests never detect.
The reason is simple: HbA1c is an average. It cannot reveal how your body behaves after meals, how efficiently you clear glucose, or whether your metabolism is quietly drifting into trouble.
Emerging research — and our own clinical experience — shows that Continuous Glucose Monitoring (CGM) is one of the most powerful tools available for identifying early metabolic dysfunction and preventing type 2 diabetes.
This article summarises key insights from our paper, Continuous Glucose Monitoring as an Early Warning System for Non-Diabetic Hyperglycaemia, and explains in plain language how CGM is reshaping our understanding of metabolic health. It also describes why CGM is one of the five core devices recommended to use at home in the Metabolic Toolkit, as discussed in the VAT-Trap book Track Your Heart Health.
1. A “Normal” HbA1c Doesn’t Always Mean a Healthy Metabolism
HbA1c reflects the average glucose level over approximately 12 weeks. It is a valuable and widely used test, essential for diagnosing diabetes.
However, large population studies show that cardiovascular and metabolic risk rises continuously across the entire HbA1c spectrum — even within the “normal” range below 42 mmol/mol.¹–⁴
In short:
You can have a “normal” HbA1c and your glucose/insulin profile can still be a risk factor for heart disease and you can still be on the road to diabetes.
HbA1c cannot detect:
- Harmful glucose spikes after meals
- Rapid fluctuations (glycaemic variability)
- Hidden hyper-insulinaemia
- Delayed glucose clearance
Someone with an HbA1c of 37 mmol/mol might still experience multiple daily spikes above 9–10 mmol/L — the range associated with early metabolic dysfunction.
2. The Carbohydrate-Sensitive Phenotype (CSP): Your Personal Glycaemic Fingerprint
Following the invention of the real time glucose monitor, developed and licensed principally for diabetics, the CGM innovation has increasingly been used in non-diabetics to help prevention.
One of the most important discoveries in modern nutrition is that people respond very differently to the same food.
A muffin might barely affect one person’s glucose, while another experiences a sharp spike within 20 minutes.⁶
At SCVC, we refer to those patients who react strongly to carbohydrates as having the carbohydrate-sensitive phenotype (CSP).
People with CSP tend to:
- Spike higher and faster after high glycaemic meals
- Show greater variability between meals
- Accumulate more visceral fat (VAT)
- Can drift towards pre-diabetes
- Can feel tired after carbohydrate-heavy meals
- Gain weight despite “healthy” eating
This is not a personality trait — it’s a biological one, influenced by your gut microbiome, liver, pancreas, skeletal muscle, and genes.
Until now, most people had no way of knowing which phenotype they belonged to. CGM changes that.
3. Glucose Spikes: Why They Happen — and Why They Matter
Minor Spikes (7.8–9 mmol/L): A Fast-Absorption Problem
Minor spikes result from:
- Eating a carbohydrate-rich meal or drink too quickly
- High glycaemic foods (smoothies, fruit juices) where fibre has been removed
- Ultra-processed foods (UPFs) containing hidden sugars
- Cereal bars, wraps, ciabatta sandwiches
These foods funnel sugars into the liver faster than it can convert them into glycogen or fat. The liver becomes transiently overloaded, glucose spills into the bloodstream, and a small spike occurs — even in those with good insulin sensitivity.²–⁴
Major Spikes (9.5–12+ mmol/L): A Muscle and Insulin-Resistance Problem
Major spikes can indicate reduced glucose uptake by skeletal muscle due to insulin resistance or elevated free fatty acids. The liver may also release glucose when it shouldn’t — classic physiology of early insulin resistance.⁷–⁹
People in this category often feel foggy, hungry, or sleepy after meals and may gain weight despite a seemingly reasonable diet.
The “Non-Spiker with VAT” Pattern
Some people, we presume due to genetic variants, who are overweight and / or have raised visceral adipose tissue, will show few visible glucose spikes but may still have:
- Slow glucose clearance
- High insulin release
- A high glucose area-under-the-curve (AUC)
Their glucose curve looks flatter, but glucose remains elevated longer — meaning the total exposure (AUC) is higher. This pattern suggests the metabolism is working harder behind the scenes.
For this reason it is important to Interpret CGM results in the context of:
- Waist-to-height ratio (if >0.5, VAT is likely)
- BMI, blood pressure, HbA1c, and lipid profile — all easily measurable markers.
4. The Muscle Mass Buffer: Why Exercise Flattens Your Curve
Skeletal muscle is the body’s main glucose “sponge”. When you walk, climb stairs, dance, garden, or lift weights:
- Muscle glucose demand increases
- GLUT-4 transporters move to the cell surface
- Glucose uptake rises dramatically
- Spikes become smaller or disappear
That’s why:
- A walk before or after meals flattens glucose curves¹⁰
- People with more muscle mass spike less
- Even a GT3 (high spiker) individual can show normal curves on active days
- Sarcopenia (muscle loss with age) can contribute to more glucose spikes.
This is one of the most empowering lessons people learn from CGM.
5. Ultra-Processed Foods and the Illusion of “Healthy Eating”
CGM often reveals that many supposedly “healthy” foods are metabolic traps.
Common culprits include:
- Sandwiches (white, wholemeal, or seeded — the effect is similar)
- Granola
- Sweet apples, ripe bananas, mango, pineapple
- “No added sugar” fruit drinks
- Low-fat yoghurts with glucose–fructose syrup
- Wraps, burritos, paninis
- Smoothies
These foods spike glucose not because they’re high in calories, but because they flood the liver with sugar rapidly. CGM makes these invisible spikes visible — in real time.
6. Glucotype and CGP: Two Tools for Understanding Your Curve
Our short paper (referenced below) introduces two simple classification systems:
Glucotype (GT1–GT3) – Your innate response
- GT1: Small rise after carbohydrates
- GT2: Moderate rise
- GT3: Strong rise (CSP)
Current Glucose Profile (CGP I–V) – Your current physiology
- CGP I–II: Stable, low variability
- CGP III: Moderately reactive
- CGP IV–V: High glucose exposure (AUC), with or without spikes
Together, these reveal:
- Your carbohydrate sensitivity
- Your metabolic status
- How food, sleep, stress, exercise, and VAT influence your curve
- Whether your metabolism is improving or deteriorating
This creates a clear, practical map of your metabolic health.
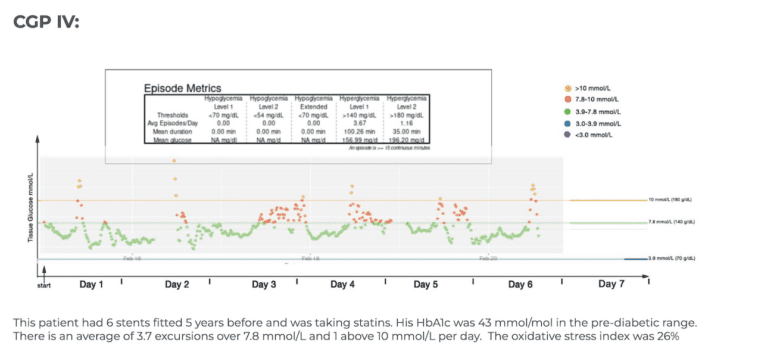
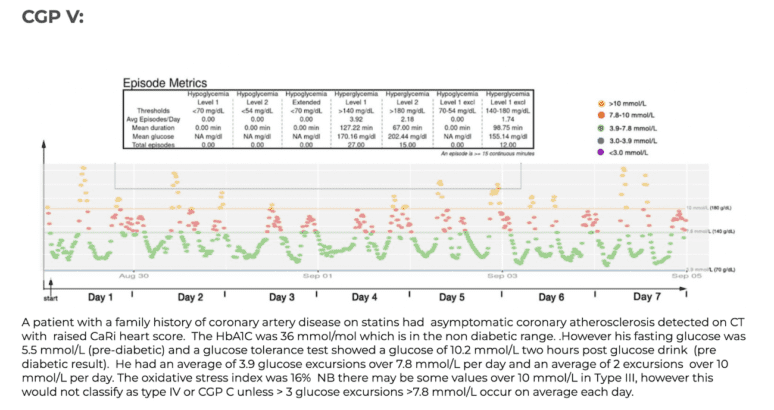
CGP Examples
The 5 panels below illustrate the range of current glucose profile (CGP) results that we typically see in our non diabetic cardiac patients. Each coloured dot represents individual glucose values measured over a week. Healthy glucose values are shown in green, mildly elevated (>7.8 mmol/L/140 mg/dL) in red and high (>10 mmol/L/180 mg/dL) in orange. By standardizing the x and y axis our such graphs makes it easier to compare like with like and from this and review of food photos, patterns emerge.

7. What We See in Practice
In our clinic:
✅ No patient with pre-diabetic HbA1c had a healthy CGM pattern (CGP I or II).
✅ Many patients with normal HbA1c showed highly reactive (CGP III–V) curves.
✅ Several patients in CGP IV–V progressed to pre-diabetic HbA1c within a year.
✅ Patients using CGM to guide food choices improved their glucose curves.
✅ Some reduced HbA1c from pre-diabetic to normal within six months.
These findings mirror scientific data: post-meal glucose behaviour predicts diabetes risk more accurately than fasting glucose or HbA1c.⁸–¹⁰
8. CGM as a Behaviour-Change Engine
The transformative power of CGM lies not in the numbers — but in the feedback.
When you eat something and see your glucose spike within minutes, it creates a powerful learning moment.
CGM teaches people:
- Which foods their body tolerates well
- Which meals cause large spikes
- How to combine foods effectively
- How a walk prevents spikes
- Why sleep and stress matter
- How timing changes glucose responses
This is personalised nutrition in its purest form. Once people see their own biology in action, they rarely return to guesswork.
9. Why CGM Matters Before Diabetes — Not After
CGM can reveal metabolic changes years before routine blood tests. It detects:
- Early carbohydrate sensitivity
- Early hepatic overload
- Early skeletal muscle inefficiency
- VAT-related insulin resistance
- Early hyperinsulinaemia
These early signals are reversible — but if we wait for fasting glucose or HbA1c to rise, reversal becomes much harder.
That’s why CGM is such a powerful preventative tool, not merely a diagnostic one.
10. Conclusion: Your Glucose Curve Is Your Metabolic Story
Continuous Glucose Monitoring provides a window into the rhythm, responsiveness, and resilience of your metabolism. It helps reveal:
- Your carbohydrate sensitivity
- Your glucose clearance capacity
- How lifestyle affects your physiology
- How much insulin you may be producing
- The overall strain on your metabolism
For many, CGM is the wake-up call that proves:
“Healthy eating” is not universal — it must be personalised.
Once you can see what your glucose is doing, change becomes logical and achievable.
CGM is not just a device — it’s a metabolic education system, a feedback tool, and an early warning system that can prevent disease before it begins.
References
- Selvin E, Steffes MW, Zhu H, Matsushita K, Wagenknecht L, Pankow J, et al. Glycated hemoglobin, diabetes, and cardiovascular risk in nondiabetic adults. N Engl J Med. 2010;362:800–11.
https://doi.org/10.1056/NEJMoa0908359 - Bonora E, Formentini G, Calcaterra F, Lombardi S, Marini F, Zenari L, et al. Relationship between HbA1c levels and cardiovascular disease. Diabetologia. 2021;64:2758–67.
https://doi.org/10.1007/s00125-021-05547-0 - Khaw KT, Wareham N, Bingham S, Luben R, Welch A, Day N. Glycated haemoglobin, diabetes, and mortality in men in Norfolk. BMJ. 2001;322:15–18.
https://www.bmj.com/content/322/7277/15 - Barr ELM, Boyko EJ, Zimmet PZ, Wolfe R, Tonkin AM, Shaw JE. HbA1c and cardiovascular mortality in non-diabetic populations. Diabetologia. 2009;52:2214–22.
https://doi.org/10.1007/s00125-009-1486-6 - Monnier L, Mas E, Ginet C, Michel F, Villon L, Cristol J, et al. Glucose variability and oxidative stress: a target for glycaemic control. Diabetes Care. 2006;29:455–60.
https://doi.org/10.2337/diacare.29.02.06.dc05-1724 - Zeevi D, Korem T, Zmora N, Israeli D, Rothschild D, Weinberger A, et al. Personalized nutrition by prediction of glycaemic responses. Cell. 2015;163:1079–94.
https://doi.org/10.1016/j.cell.2015.11.001 - DeFronzo RA. From the triumvirate to the ominous octet: a new paradigm for the pathogenesis of type 2 diabetes. Diabetes. 2009;58:773–95.
https://doi.org/10.2337/db09-9028 - Després JP, Lemieux I. Abdominal obesity and metabolic syndrome. Nat Rev Endocrinol. 2012;8:88–99.
https://doi.org/10.1038/nrendo.2011.138 - Moore MC, Coate KC, Winnick JJ, An Z, Cherrington AD. Regulation of hepatic glucose uptake and release by the liver. Am J Physiol Endocrinol Metab. 2012;302:E1033–50.
https://doi.org/10.1152/ajpendo.00062.2012 - Richter EA, Hargreaves M. Exercise, glucose transport, and insulin sensitivity. Physiol Rev. 2013;93:993–1017.
https://doi.org/10.1152/physrev.00038.2012
Technical papers: located in Dr Leatham’s “VAT Trap” Digital Companion and Resources
- Continuous-Glucose-Monitoring-as-an-Early-Warning-System-for-Non-Diabetic-Hyperglycaemia-2.pdf
Related posts