An article by Dr Edward Leatham, Consultant Cardiologist
Coronary heart disease begins decades before symptoms
Coronary heart disease (CHD) remains one of the leading causes of premature death worldwide and is a major contributor to morbidity across developed countries. One of the most important facts about CHD is that the disease process begins silently and often decades before symptoms appear.
Pathological studies have shown that early changes may start as early as a person’s twenties. At this stage, fatty streaks develop within the coronary arteries — findings commonly observed by pathologists during autopsy studies, even in young individuals who died from non-cardiac causes such as accidents. These early changes highlight that coronary disease is not an abrupt event but a long, progressive biological process.
Atherosclerosis as a chronic inflammatory condition
Modern cardiology increasingly recognises atherosclerosis as a chronic inflammatory disease rather than simply a passive build-up of cholesterol. Over many years, inflammatory cells — including foam cells within the arterial intima — interact with LDL cholesterol, leading to the gradual formation of focal plaques within the coronary arteries.
Initially, these plaques are non-calcified and soft in composition. They tend to develop in predictable locations, particularly in the proximal segments of the coronary arteries. During this early phase, the disease is invisible to most traditional tests and can only be detected using high-resolution imaging modalities such as intravascular ultrasound or advanced CT techniques.
As inflammation continues, plaques slowly evolve. The soft, lipid-rich material gradually calcifies, transforming into harder, more stable plaques. Although calcification is often viewed negatively, it frequently represents a stabilisation phase of plaque biology, reducing the likelihood of acute rupture.
Importantly, it is only at this stage — when calcification appears — that coronary artery disease becomes visible on a non-contrast CT calcium scan. By the time coronary calcification is detected using a coronary artery calcification (CAC) score, the disease has usually been present for many years.
When plaques become obstructive
In earlier stages, the coronary artery can compensate for plaque growth by expanding outward — a process known as positive remodelling. Eventually, however, this compensatory mechanism reaches its limit. At this point, plaques begin to encroach upon the arterial lumen, producing flow-limiting areas of scar tissue.
It is only at this relatively advanced stage that symptoms typically arise, including:
- Angina on exertion
- Reduced exercise tolerance
- Acute coronary syndromes, including heart attack
Many of the traditional diagnostic tests used in cardiology — such as stress ECG, stress echocardiography, nuclear perfusion imaging, and myocardial perfusion scans — often only become abnormal when disease has progressed to this stage.
The CT imaging revolution in cardiology
Over the past decade, advances in cardiac computed tomography (CT) have transformed our understanding of coronary artery disease. CT imaging now allows cardiologists to look beyond simple obstruction and explore the biological activity of disease within the artery wall itself.
Coronary Artery Calcium (CAC) scoring
CAC scoring remains a valuable and widely used tool for risk assessment. It provides a simple measure of overall calcified plaque burden and helps estimate long-term cardiovascular risk. However, calcium scoring detects only one phase of disease — the later calcified stage.
CT Coronary Angiography (CTCA)
CT coronary angiography offers a more comprehensive assessment, allowing visualisation of both calcified and non-calcified plaque. This makes CTCA particularly useful for detecting patients who may have significant non-calcified disease despite low or absent calcium scores.
The CaRi heart score and Fat Attenuation Index (FAI)
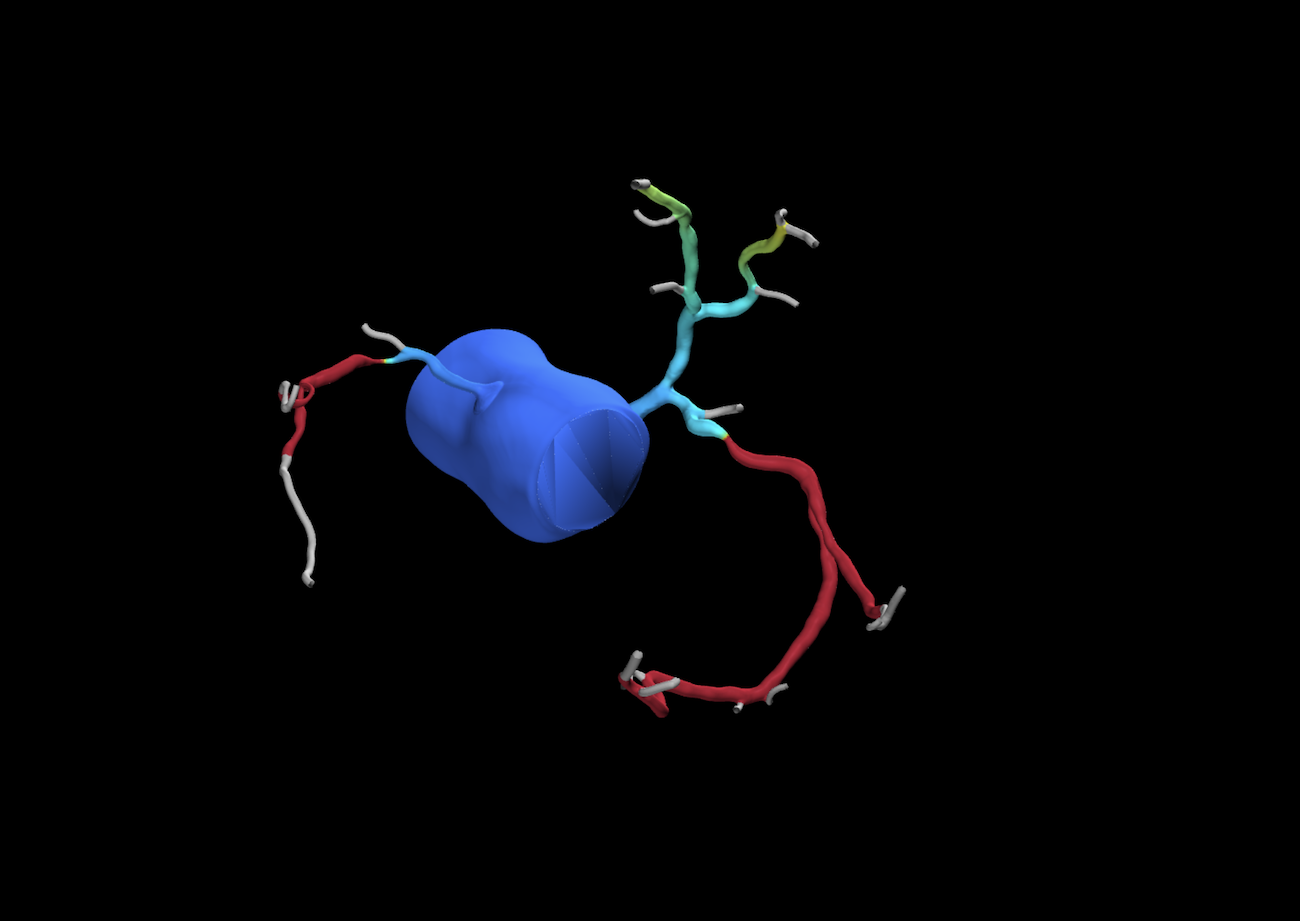
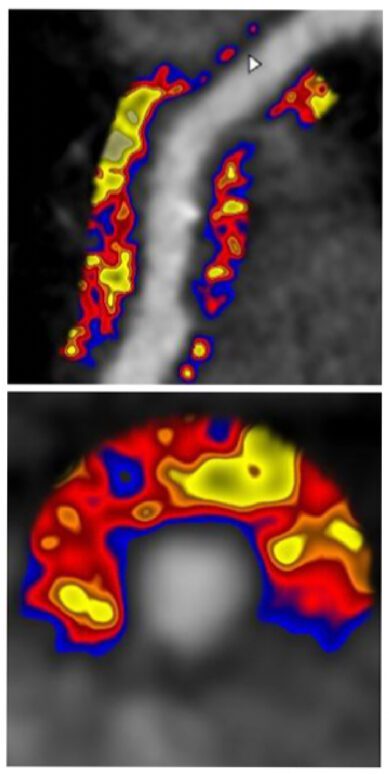
A major recent advancement is the development of the CaRi heart score, pioneered by researchers in Oxford. This approach applies artificial intelligence and machine-learning analysis to cardiac CT images to measure the Fat Attenuation Index (FAI) — an indirect marker of inflammation around the coronary arteries.

FAI analysis evaluates subtle changes in CT grey-scale values within the adipose tissue surrounding each coronary artery. These tissue changes reflect inflammatory signals originating from the artery wall itself.
When combined with age and traditional risk factors, FAI allows clinicians to:
- Identify coronary inflammation before significant plaque or calcification develops
- Improve cardiovascular risk prediction
- Estimate cardiovascular mortality risk over an extended follow-up period
- Tailor prevention strategies more precisely
In clinical practice, this represents a significant shift — moving from simply detecting existing disease to identifying biological activity that may predict future events.
Personalised use of cardiac CT imaging
The growing range of CT-based tools has led to a more individualised approach to screening and risk assessment.
- Younger individuals (>40 years) without symptoms:
CT angiography is generally not recommended due to low pre-test probability and radiation considerations. - Patients with symptoms suggestive of coronary disease:
CT coronary angiography, often combined with visual calcium assessment, provides valuable diagnostic information while minimising unnecessary testing. - Asymptomatic individuals concerned about future risk:
CT assessment incorporating FAI and the CaRi heart score can provide additional insight, particularly for patients in their 30s – 50s where traditional risk models may underestimate risk. This may be recommended in those who have risk factors, such as very high LDL or a family history of 1st degree relative affected <60 yrs.
By identifying early inflammation and non-calcified disease, cardiologists can intervene earlier with lifestyle modification, preventive therapies, and risk-factor optimisation.
The future of prevention-focused cardiology
Cardiac CT has moved beyond simply identifying blockages. Modern imaging now allows us to understand where a patient sits along the spectrum of coronary disease — from early inflammation to calcified plaque and obstructive disease.
This shift supports a more proactive model of care focused on:
- Early detection
- Individualised risk stratification
- Evidence-based prevention
- Precision treatment planning
Through detailed pre-consultation assessment and careful selection of imaging strategies, cardiologists can tailor investigations to each patient’s age, symptoms, and risk profile — improving both accuracy and outcomes.
Final thoughts
Coronary heart disease is a long-term process that often begins silently early in life. Advances in CT imaging — particularly CT coronary angiography, FAI analysis, and the CaRi heart score — now allow clinicians to detect disease much earlier than ever before.
The aim is no longer simply to diagnose disease once symptoms occur, but to identify risk earlier, intervene sooner, and prevent future heart attacks before they happen.