Metabolic Health Assessment (MHA) — Early Detection of Insulin Resistance Beyond HbA1c
Standard blood tests can miss insulin resistance for years — a structured metabolic assessment identifies cardiovascular risk long before glucose levels tip into the diabetic range.

For busy people, or to tune in when on the move, a Google NotebookLM audio podcast is available as a story beneath.
Insulin resistance is now understood to be one of the earliest and most consequential drivers of cardiovascular disease, yet it remains clinically invisible to the tests most commonly used in primary care. The mechanism is deceptively simple: the pancreas compensates for failing insulin sensitivity by producing progressively more insulin, keeping blood glucose artificially normal while the underlying pathology advances silently. This article explains what a structured Metabolic Health Assessment involves, how it closes the diagnostic gap, and what GPs and patients should look for before HbA1c ever becomes abnormal.
The Diagnostic Blind Spot in Metabolic Disease
A patient sits in front of you with a BMI of 28, a waist circumference of 97 centimetres, fatigue that she attributes to a busy life, and an HbA1c of 38 mmol/mol — solidly normal. She is reassured. She leaves. And yet the biological machinery of insulin resistance may have been running in the background for a decade.
This is the central problem that the Metabolic Health Assessment is designed to address. HbA1c measures average blood glucose over approximately two to three months. It is an excellent marker for monitoring established diabetes, but it is a poor screening tool for early metabolic dysfunction, because it only becomes abnormal once the compensatory capacity of the pancreas is already substantially exhausted. By the time HbA1c rises, a patient may have spent years in a state of sustained hyperinsulinaemia — persistently elevated insulin — during which visceral fat has been quietly accumulating, systemic inflammation has been building, and arterial walls have been sustaining repeated oxidative injury from post-meal glucose excursions that HbA1c cannot detect at all.
Think of HbA1c as a fuel gauge that only registers empty when the tank has almost run dry. Insulin resistance is the slow puncture you never noticed.
The mechanism deserves a moment’s attention because it explains why standard testing fails. In healthy metabolism, a modest insulin response clears glucose efficiently from the bloodstream after a meal. In insulin-resistant tissues, the same signal is progressively ignored, rather like turning up the volume on a radio with a failing speaker — more signal, diminishing effect. The pancreas responds by secreting more and more insulin to achieve the same result. For years, glucose remains controlled and HbA1c stays normal. But the sustained high-insulin environment actively promotes visceral fat deposition — the metabolically harmful fat stored around the abdominal organs — and drives a state of low-grade systemic inflammation that is now well recognised as a promoter of atherosclerosis.
What a Metabolic Health Assessment Actually Measures
The MHA is built around four components: direct measurement of insulin dynamics, continuous real-world glucose profiling, vascular lipid particle analysis, and anthropometric markers of visceral adiposity. Together, these four pillars provide a picture of metabolic health that no single standard test can replicate.
Fasting insulin and one-hour post-load insulin, alongside C-peptide — a byproduct of insulin synthesis that reflects pancreatic secretory effort — reveal whether the body is quietly overworking to maintain normal glucose. Elevated fasting insulin with a normal fasting glucose is one of the earliest detectable signs of insulin resistance, and it is entirely invisible on routine biochemistry panels. C-peptide is particularly useful because, unlike insulin itself, it is not cleared by the liver on first pass and therefore gives a more stable reflection of pancreatic output.
Continuous Glucose Monitoring, worn for one to two weeks, provides something HbA1c never can: the dynamic glucose response to real food, real stress, and real sleep patterns. From this, two distinct clinical profiles emerge. The Glucotype — classified GT1 through GT3 — reflects an individual’s innate carbohydrate sensitivity, the degree to which their glucose rises in response to a standardised carbohydrate load. This appears to be a fixed physiological characteristic, not meaningfully altered by short-term dietary changes during the testing period. Glucotype GT2, characterised by moderate glucose variability, affects a substantial proportion of the adult population. The Current Glucose Profile, classified CGP I through V, reflects actual dietary behaviour during the monitoring period and is fully modifiable. The letter suffix — A or B for a healthy waist-to-height ratio, C through E for the visceral fat risk range — incorporates the single most practical anthropometric measure in metabolic medicine: waist circumference expressed as a fraction of height.
That waist-to-height ratio threshold of 0.5 — waist circumference exceeding half of height — is a simple, costless, and evidence-supported marker of visceral adiposity that carries cardiovascular implications even when blood glucose is entirely normal.
The lipid panel within the MHA extends beyond standard cholesterol fractions to include ApoB, lipoprotein(a), and triglycerides. ApoB measures the number of atherogenic particles in circulation — each LDL, VLDL, and IDL particle carries exactly one ApoB molecule — making it a direct count of the particles capable of entering arterial walls and initiating atherosclerosis. A patient can have a normal or even low LDL-cholesterol level while carrying a high burden of small, dense, ApoB-rich particles that their standard lipid profile entirely misses. Vitamin D is included because deficiency is independently associated with insulin resistance and cardiovascular risk, and is highly prevalent in the UK population.
What the Evidence Shows
The case for looking beyond HbA1c is well supported in the literature. The concept of post-meal glucose spikes as an independent cardiovascular risk factor has been established in large epidemiological work, including the DECODE study, which demonstrated that two-hour post-load glucose predicted cardiovascular mortality independently of fasting glucose — a finding that directly challenged the primacy of fasting-state measurements in risk stratification.
The cardiovascular consequences of insulin resistance itself — independent of frank diabetes — are now extensively documented. The landmark EMPA-REG OUTCOME trial demonstrated that targeting metabolic pathways in patients with established type 2 diabetes substantially reduced cardiovascular events and heart failure hospitalisations, reinforcing the mechanistic connection between metabolic dysfunction and cardiovascular disease. More recently, NICE guidance NG238 on cardiovascular risk assessment has placed increasing emphasis on identifying high-risk individuals earlier and using a broader range of biomarkers, reflecting the evidence that standard risk calculators underestimate risk in metabolically compromised patients.
ApoB as a superior predictor of cardiovascular risk compared with LDL-cholesterol is now supported by a substantial body of evidence, including data from the FOURIER trial, which showed that aggressive lowering of ApoB-containing particles with evolocumab reduced major cardiovascular events in patients whose LDL was already well controlled on statins — implying that particle number, not just cholesterol content, drives residual risk.
A pre-diabetic CGM profile CGP V
Frequent excursions over 7.8 mmol/L in response to meals. This patient had no idea they had a glucose or insulin issue
A healthy CGM profile
The glucose does not exceed 7.8 mmol/l during 2 weeks
Summary
Standard blood tests can miss insulin resistance for years, leaving cardiovascular risk undetected while glucose levels appear perfectly normal. A structured Metabolic Health Assessment uses additional markers to identify the problem early, long before HbA1c becomes abnormal and when intervention is most effective.
Related Blog Articles
- The Cardiometabolic Reset: Escaping the Metabolic Doom Loop
- https://www.scvc.co.uk/cardiovascular-prevention/vat-metabolic-reset/
- Interpreting Your Own CGM Data: A Guide for Non-Diabetics and Health Enthusiasts
- https://www.scvc.co.uk/cardiovascular-prevention/interpreting-cgm-data-non-diabetics/
- Interpreting Liver Function Tests in MASLD: Why “Normal” May No Longer Mean Healthy
- https://www.scvc.co.uk/diagnostic-health-screening/interpreting-lfts-masld/
- Why an Annual Health Screen can now be a ‘Win Win’ for both Employers and Employees
- https://www.scvc.co.uk/diagnostic-health-screening/annual-health-screen-benefits/
- The Role of Gain of Function Mutations in Heart Disease
- https://www.vat-trap.com/post/visceral-fat-heart-disease
Blog post:
https://www.scvc.co.uk/diagnostic-and-health-screening/insulin-resistance-metabolic-health/
Referenced version (UK English only):
https://mhaat.vercel.app/s-insulin-resistance-metabolic-health.html



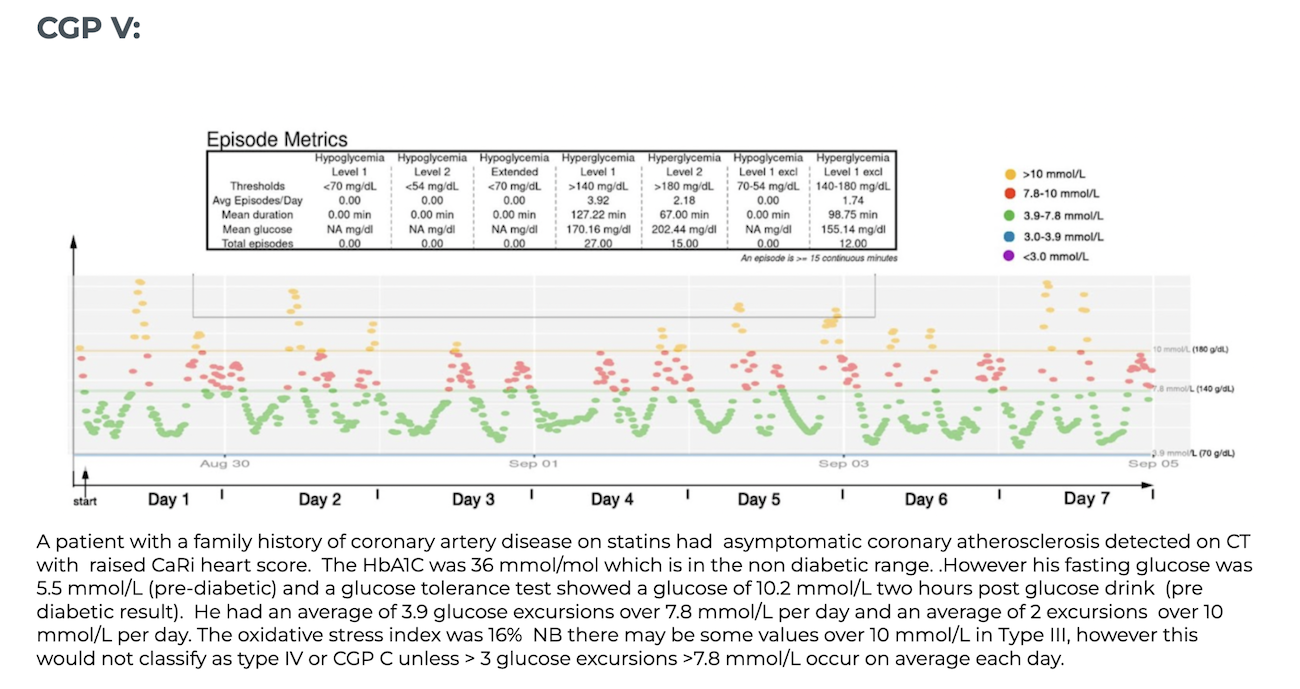 A pre-diabetic CGM profile CGP V
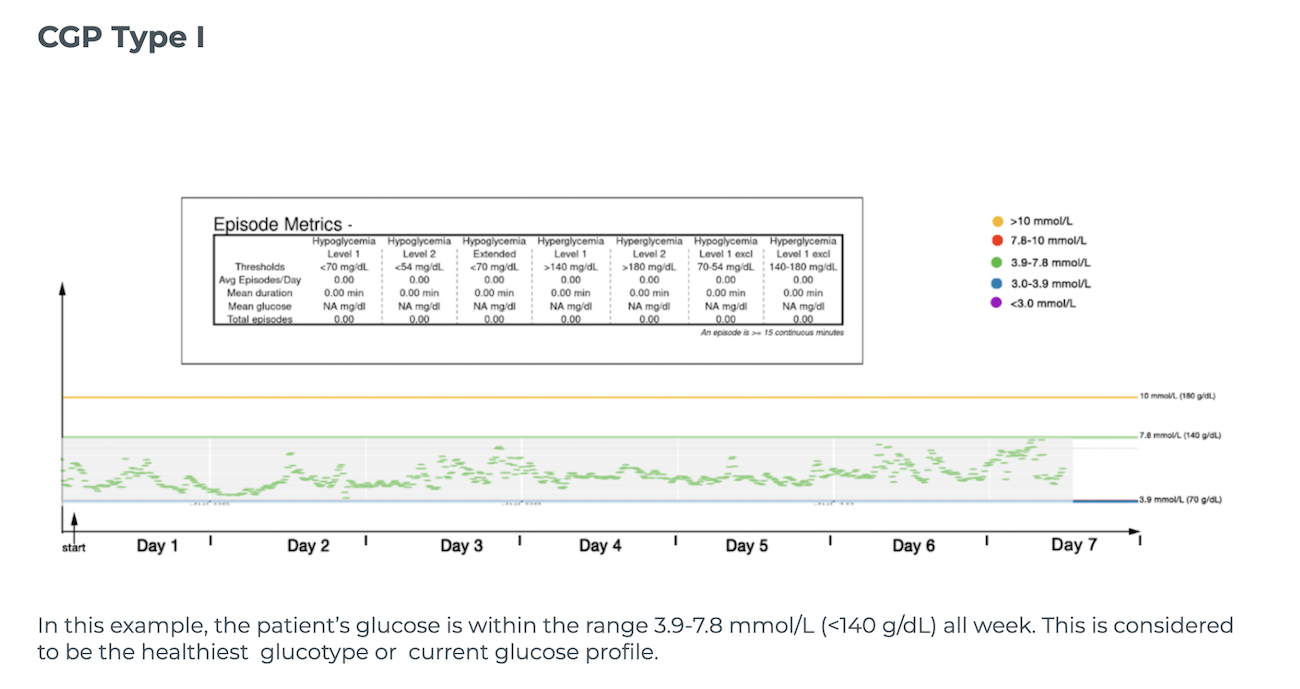 A healthy CGM profile