An article written by Dr Edward Leatham, Consultant Cardiologist
For more information about Cardiology 3.0 and how a VAT CT scan can be used to measure your visceral adipose tissue, a leading cause of heart disease and poor metabolic health linked to reduced healthspan, see the blog articles or and/or register for the book series out in 2026 https://www.vat-trap.com/
Futuristic ‘Cardiology 3.0’ – A CT scanner is used not only to assess coronary plaque burden and inflammation (FAI ), but can also to obtain a cross-sectional image of the abdomen 3 cm above the lower most margin of the lumbar spinal vertebral body. We use specialist software to ‘window’ the fat tissue in range of -150 to -50 Hounsfield units following image transfer to a Terarecon workstation. We then identify the lining of the peritoneal cavity (thin red line) allowing the partitioning of relatively innocuous subcutaneous fat (in blue) and the more noxious visceral adipose tissue (VAT, in green). The area in one CT slice correlates very well with total VAT, and when presented as an indexed metric (VATI= VAT/(Height in M)2, allows comparison of the result with those whose long term outcome has been followed in large population cohort studies. The application of this science allows us better identify and treat those patients that may feel well but are most at risk, instead of firefighting the crisis that will eventually follow.
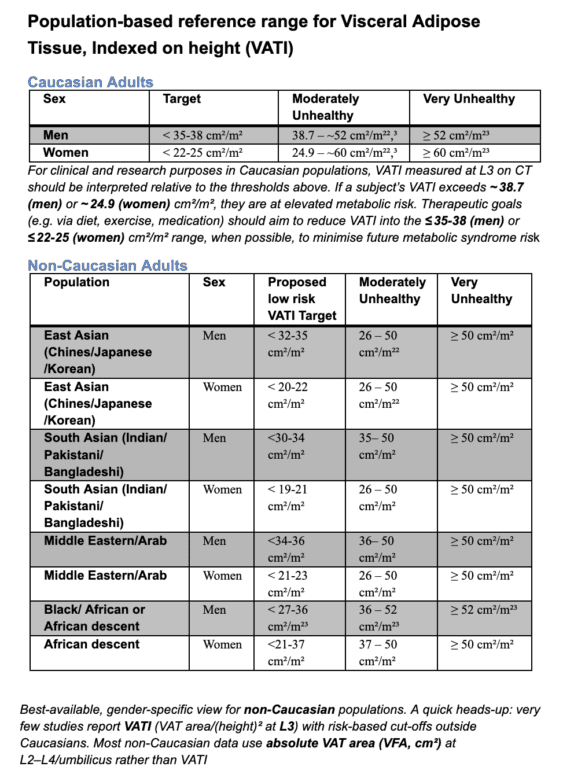
Table of reference ranges

Our reference range for reporting of VATI (visceral adipose tissue index, which is the VAT in cm2 divided by the square of the height (measured in M). The table is taken from our fully referenced (non peer reviewed) paper linked below
Examples
Case 1: a male patient with expanded waist where the visceral adipose tissue score of 88 cm2 is low- he is overweight, but ‘metabolically healthy’
With a waist of over 100 cm, you might imagine this overweight man would have a terrifically unhealthy VAT. The CT shows most of his adipose is subcutaneous not visceral. His VAT was 88 cm2, which is normal. Although the patient is overweight and advised to lose weight for best health, he is currently ‘metabolically healthy’.
Case 2 Obese male, metabolically health (OMH)
A man with waist of over 123 cm and BMI categorised as ‘obese’. The CT shows most of his adipose is subcutaneous not visceral. His VAT area measured 119 cm2 – which is normal for his height. Although obese , he is currently ‘metabolically healthy’.
Case 3 Overweight with very unhealthy visceral adipose tissue score
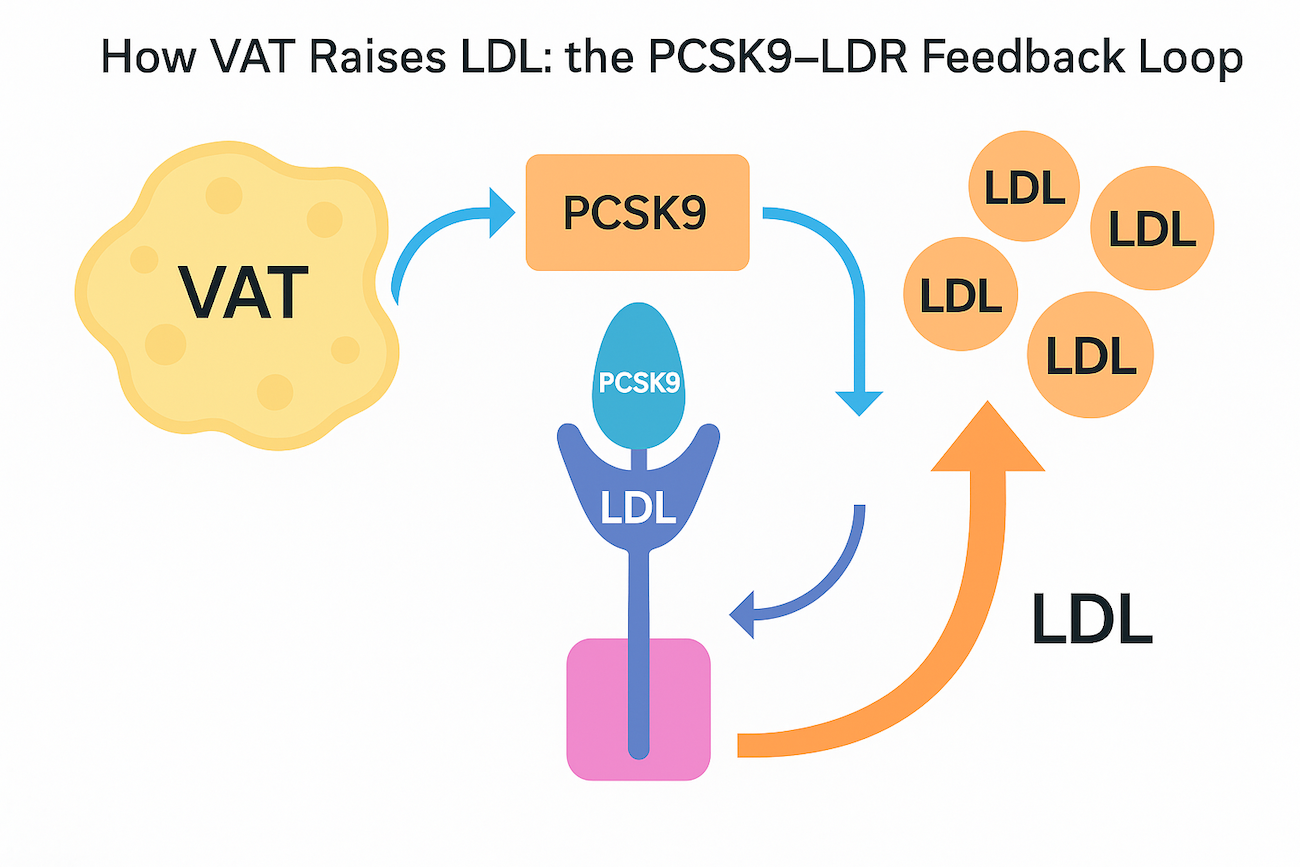
A man with raised FAI and some middle age spread, similar to those above, whose waist measured 111 cm . However his CT shows that most of his adipose is visceral not subcutaneous distribution. His VAT measures 211 cm2 – which is very high, when corrected for his height. This amount of VAT is thought to flood the liver with cytokines and free fatty acids, contributing to insulin resistance (which then leads to more VAT), raised small dense LDL. A FACTS most doctors don’t know: high VAT is metabolically extremely unhealthy. In populations with expanding waistlines, visceral adipose tissue fuelled by dietary sugars and carbohydrates is a more potent cause of coronary heart disease then dietary intake of saturated fats.
Case 4 A man with very high FAI score on cardiac CT despite a year of statin therapy
A man with extensive coronary artery disease, raised hsCRP and very raised coronary inflammation (FAI) despite statins, who had some ‘middle age spread’ with waist measured 110 cm . We investigated this further and found that his CT shows that most of his adipose is visceral not subcutaneous. His VAT measured 235 cm2 – which is very high when corrected for his height. He is thus has a normal weight (as has reduced muscle mass) but is metabolically extremely unhealthy. Now starting GLP-1 mimetic therapy.
Paired VAT scan can be repeated after GLP-1M intervention.
Case 3 before and after 3 months of ‘VAT-reduction’ therapy’ using lifestyle, weight training and microdose GLP-1 mimetic. Paired CT VAT scans taken using identical CT slice with identical settings 3 cm above the lower margin of L3. The VAT dropped from 211 cm2 to 123 cm2 (from unhealthy into the ‘metabolically healthy’ range), with his waist dropping 10 cm and weight falling from 102 Kg to 92 Kg. With his increase in skeletal muscle, this intervention is termed ‘remodelling’ or ‘metabolic reset’.


 A man with raised FAI and some middle age spread, similar to those above, whose waist measured 111 cm . However his CT shows that most of his adipose is visceral not subcutaneous distribution. His VAT measures 211 cm2 – which is very high, when corrected for his height. This amount of VAT is thought to flood the liver with cytokines and free fatty acids, contributing to insulin resistance (which then leads to more VAT), raised small dense LDL. A FACTS most doctors don’t know: high VAT is metabolically extremely unhealthy. In populations with expanding waistlines, visceral adipose tissue fuelled by dietary sugars and carbohydrates is a more potent cause of coronary heart disease then dietary intake of saturated fats.