Understanding CGM Results: Glucotype, Current Glucose Profile (CGP) and VAT Status
Dr Edward Leatham, Consultant Cardiologist
First published April 2024. Updated March 2026 with the addition of VAT status combined with Current Glucose Profile (CGP) classification and some clarification of the Glucotype concept.
This article is for informational purposes only and does not constitute medical advice. Please consult a qualified healthcare professional before making health decisions. The opinions expressed in this article are entirely my own and do not necessarily reflect the views of SCVC or any broader medical consensus.
Continuous glucose monitoring is not currently recommended as a diagnostic tool for diabetes or metabolic disease without appropriate clinical evaluation.
Why Continuous Glucose Monitoring Is Becoming Important
We live in an increasingly data-driven world. In healthcare, the more information patients have about their own physiology, the better they tend to manage their health.
Many people now track metrics such as:
- Blood pressure
- Heart rate
- Body weight
- Body fat percentage
- Physical activity
- Sleep quality
More recently, continuous glucose monitors (CGMs) have become widely available. These devices allow people to see their blood glucose levels continuously throughout the day.
For individuals interested in metabolic health, CGMs provide valuable insight into how the body responds to food.
However, interpreting CGM results can be challenging, particularly in people without diabetes, who now represent one of the largest groups using these devices.
Why Glucose Responses Differ Between People
One of the most striking observations from CGM use is that people respond very differently to the same foods.
Some individuals can eat highly sugary foods with very little rise in glucose. Others experience substantial spikes even after modest carbohydrate intake.
For example:
- One person may eat a Mars bar with almost no glucose rise
- Another may experience a significant spike after drinking a glass of milk
These differences appear to reflect individual biological variation, likely influenced by:
- Genetic factors (polygenic metabolic traits)
- Gut microbiome composition
- Insulin sensitivity
- Muscle glucose uptake
- Liver metabolism
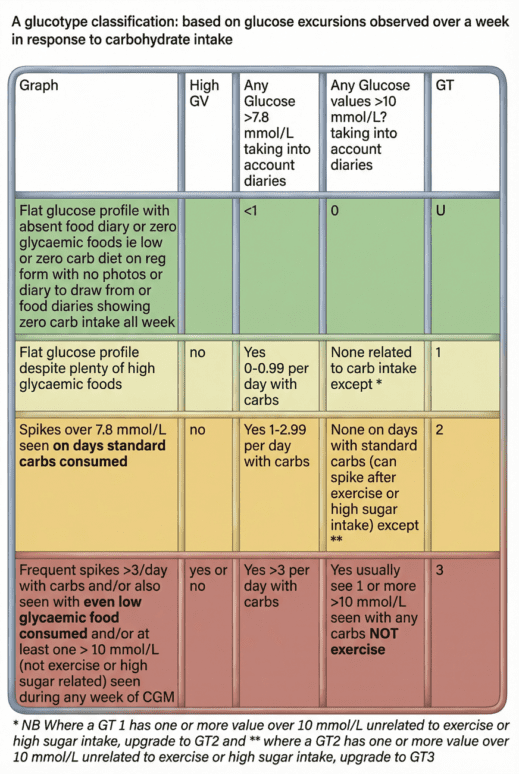
Because of these differences, we found it useful to describe an individual’s innate carbohydrate tolerance using the term ‘Glucotype‘.
What Is a Glucotype?
A glucotype describes a person’s underlying biological ability to handle high-glycaemic carbohydrate intake without significant glucose spikes.
It reflects how strongly glucose levels rise when someone consumes sugary or refined carbohydrate foods.
At our clinic, we classify individuals into three broad glucotypes:

| Glucotype | Description |
|---|
| GT1 | Very stable glucose responses even with high-glycaemic foods |
|---|
| GT2 | Moderate glucose spikes after carbohydrate intake |
|---|
| GT3 | Frequent or large glucose spikes even with relatively modest carbohydrate intake |
|---|
The tables used in this article can also be viewed and downloaded as a PDF.
In some cases, glucotype cannot be determined because the person is already eating a very low-carbohydrate diet during testing. These individuals are labelled Unclassified until a carbohydrate challenge is observed.
How Glucotype Is Determined
Glucotype is determined in our medical practice by observing the highest glucose levels reached after carbohydrate intake, particularly sugary or refined foods.
Key thresholds used are:
- 7.8 mmol/L (140 mg/dL) — often considered the upper limit of normal post-meal glucose
- 10 mmol/L (180 mg/dL) — clearly abnormal in non-diabetic individuals
The more frequently glucose exceeds these levels after carbohydrate intake, the more likely someone is to be GT2 or GT3.
Current Glucose Profile (CGP)
While glucotype reflects innate metabolic response, it does not necessarily describe how a person’s glucose behaves at the time of testing.
Many patients attending metabolic clinics have already changed their diet before testing.
For example:
- A GT3 individual who adopts a low-carbohydrate diet may show very stable glucose levels during monitoring.
- A GT2 patient who avoids sugar may have readings that look almost normal.
To describe the actual glucose pattern during monitoring, we therefore use a second classification:
Current Glucose Profile (CGP)
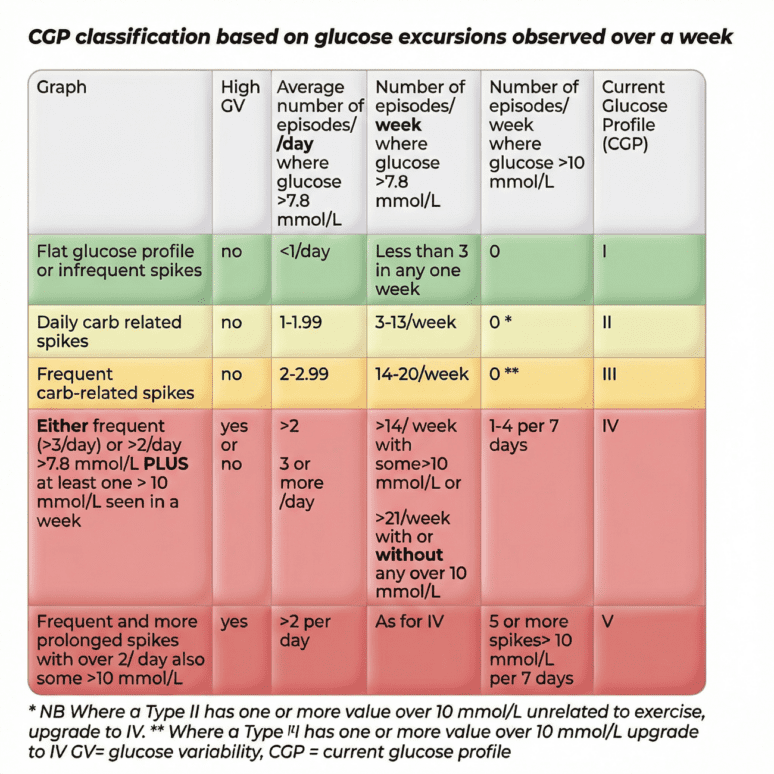
CGP describes the pattern of glucose behaviour seen during the monitoring period, regardless of the person’s underlying glucotype.
We categorise CGP into five patterns:
| CGP | Description |
|---|
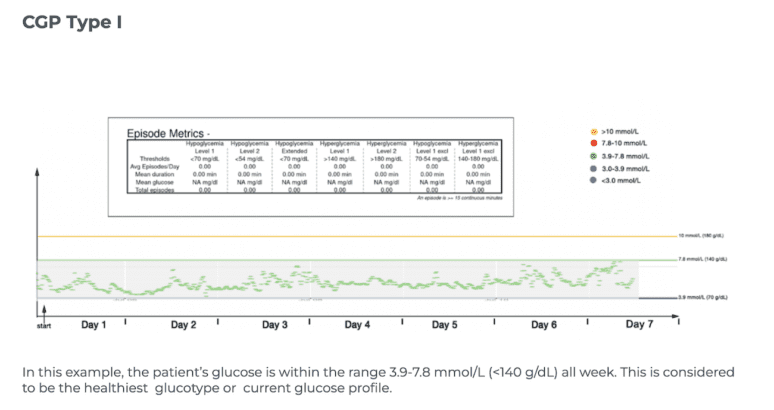
| CGP I | Very stable glucose profile with rare spikes |
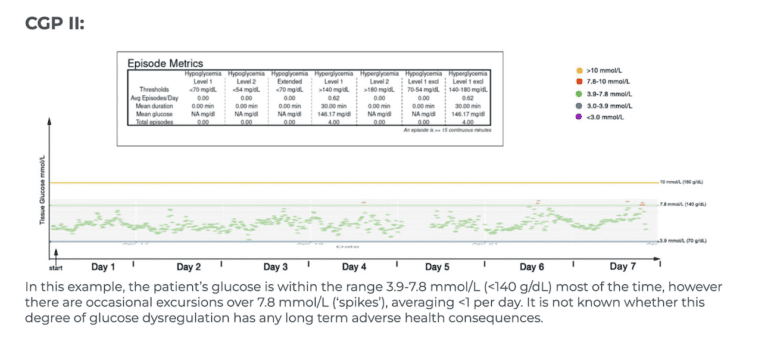
| CGP II | Occasional glucose spikes after carbohydrates |
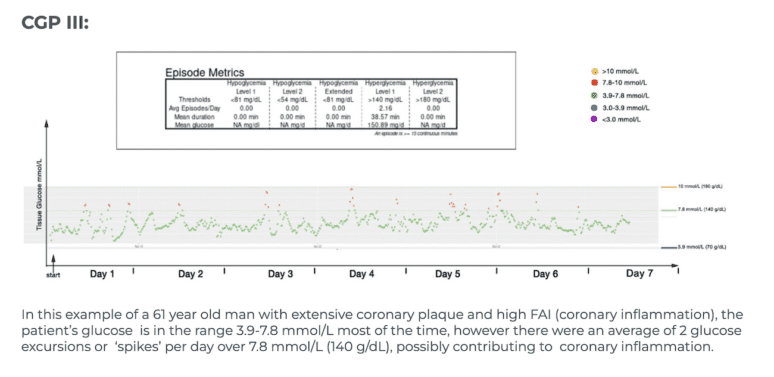
| CGP III | Frequent carbohydrate-related spikes |
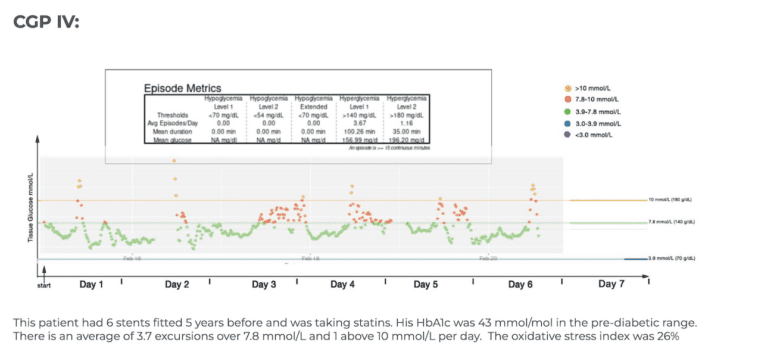
| CGP IV | Frequent spikes including some above 10 mmol/L |
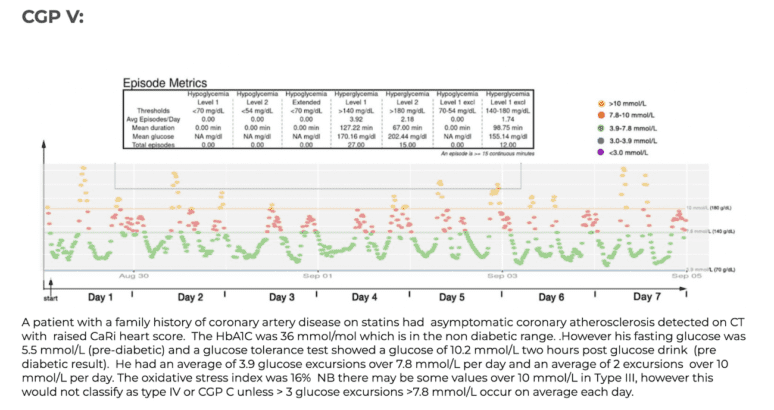
| CGP V | Very frequent and prolonged spikes above 10 mmol/L |
The tables used in this article can also be viewed and downloaded as a PDF.
Importantly:
CGP can improve dramatically with dietary changes.
For example:
A GT3 person who avoids sugar and refined carbohydrates may show CGP II or even CGP I patterns during monitoring.
This distinction between innate glucotype and current glucose behaviour is crucial when interpreting CGM data.
Why Body Fat Distribution Matters
Glucose metabolism does not exist in isolation.
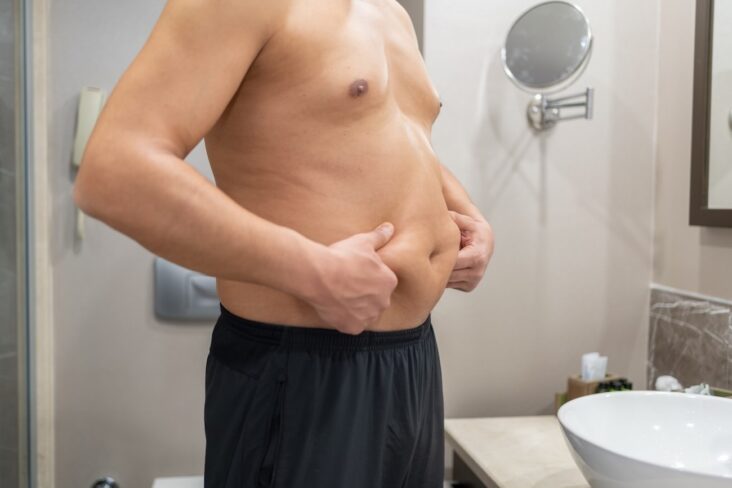
One of the strongest drivers of metabolic disease is visceral adipose tissue (VAT) — fat stored around internal organs.
High levels of visceral fat are strongly linked to:
- Insulin resistance
- Type 2 diabetes
- Cardiovascular disease
- Inflammation
- Fatty liver disease
However, some individuals with high visceral fat may still show relatively stable glucose profiles, particularly if they restrict carbohydrates.
To ensure this important risk factor is not overlooked, we add a third classification component based on waist-to-height ratio.
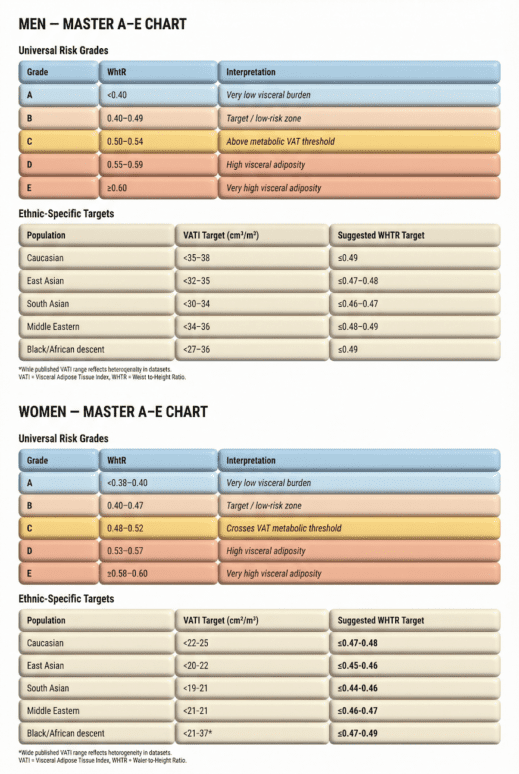
VAT Classification (A–E)
Each CGP is further labelled A–E according to visceral fat status.
This is estimated using waist-to-height ratio (WHtR).
The table defines the grade of central adiposity based on waist to height ratio, which is a simple anthropometric that correlates surprisingly well with extent of visceral adipose tissue.
| Grade | Interpretation |
|---|
| A | Very low visceral fat |
| B | Healthy target range |
| C | Above metabolic VAT threshold |
| D | High visceral adiposity |
| E | Very high visceral adiposity |
The tables used in this article can also be viewed and downloaded as a PDF.
This provides a simple way to integrate metabolic risk with glucose data.
Putting It All Together
Each patient therefore receives a combined metabolic classification:
Glucotype + Current Glucose Profile + VAT Grade
For example:
GT2 – CGP IV E
This describes a person who:
- Has moderate innate carbohydrate sensitivity (GT2)
- Currently shows frequent glucose spikes (CGP IV)
- Has very high visceral fat (Grade E)
Such individuals may be at high risk of developing prediabetes or type 2 diabetes and may benefit from aggressive metabolic treatment, including:
- Weight reduction
- Carbohydrate restriction
- GLP-1 receptor agonists
- Lifestyle interventions
In contrast:
GT1 – CGP II B
describes someone with:
- Good innate carbohydrate tolerance
- Only occasional glucose spikes
- Healthy visceral fat levels
Such individuals generally require minimal medical intervention.
Why This Classification Is Useful
This system helps clinicians interpret CGM results in a more structured way.
It separates three important metabolic factors:
1️⃣ Innate carbohydrate tolerance (Glucotype)
2️⃣ Current glucose behaviour (CGP)
3️⃣ Visceral fat burden (VAT grade)
Together these provide a more complete picture of metabolic health.
What Does a Healthy Profile Look Like?
While long-term studies are still needed, a low-risk metabolic profile typically looks like:
GT1 – CGP I B or CGP II B
This means:
- Glucose usually stays between 3.9–7.8 mmol/L
- Spikes above 7.8 mmol/L are infrequent
- Values above 10 mmol/L are rare or absent
- Visceral fat levels remain within healthy limits.
A Note on Evidence
Although CGM technology is advancing rapidly, long-term outcome studies in non-diabetic individuals are still limited.
Observational research suggests that:
- High glucose variability
- Frequent spikes above 7.8 mmol/L
- Repeated values above 10 mmol/L
may be associated with metabolic dysfunction and cardiovascular risk, but more research is required.
Until stronger evidence emerges, CGM data should be interpreted as a useful metabolic signal rather than a diagnostic tool. It is important to note that occasional glucose spikes are not necessarily harmful. However for those with frequent spikes—particularly those with early signs of heart disease—avoiding high glycaemic foods and mitigating spikes through dietary strategies like consuming high-fiber, water-rich, or acidic foods before meals, may be beneficial.
Examples of CGP I-V
To aid patients in navigating their CGM results, it can be helpful to see examples of different glucose patterns. To act as a guide here are 5 glucose monitor results presented in a standardised graphical format- where the glucose levels that are believed to be important are shown as coloured lines, the implication being that the ideal profile and CGP might be where glucose values excursions fall below the green line (7.8 mmol/L) with values over 7.8 mmol/L shown in red and values over 10 mmol/L shown in amber. In these time/glucose plots, individual glucose measurements are shown as coloured dots- healthy values depicted by green dots and high values in red or amber.
Final Thoughts
Continuous glucose monitoring offers a powerful window into human metabolism.
By combining CGM data with measures of visceral fat and an understanding of individual carbohydrate tolerance, we can begin to personalise metabolic care.
The classification system described here — Glucotype, Current Glucose Profile, and VAT grade — is designed to help both clinicians and patients interpret CGM data in a practical and clinically meaningful way.
As research evolves, these tools may play an increasingly important role in preventing diabetes and cardiovascular disease.
Conclusion
Continuous glucose monitors are a powerful tool for managing health, offering real-time insights into glucose levels that can help guide dietary and lifestyle decisions. As technology advances and more research becomes available, the potential of CGMs to support disease prevention and management will likely become even more significant. Until then, a balanced approach to diet and health, informed by CGM data, appears to be a prudent strategy for those seeking to optimize their well-being.
Medical Disclaimer
The content of this article is provided for general informational and educational purposes only and does not constitute medical advice, diagnosis, or treatment. The information reflects current understanding of glucose–insulin physiology and continuous glucose monitoring (CGM) data but should not be relied upon as a substitute for professional medical assessment.
Continuous glucose monitoring devices measure glucose levels in interstitial fluid rather than directly in blood, and readings may vary from capillary or laboratory glucose measurements. CGM data may be affected by physiological lag, device variability, sensor placement, and individual metabolic factors. Interpretation of CGM data, particularly in individuals without diabetes, requires clinical context and should be undertaken by an appropriately qualified healthcare professional.
The discussion of metabolic responses, glucose variability, or dietary patterns within this article is intended to support general understanding of metabolic health and should not be used to diagnose diabetes, insulin resistance, or other metabolic disorders. Individual metabolic responses to diet, exercise, sleep, medications, and other factors vary significantly.
No content within this article is intended to replace consultation with a qualified healthcare professional. Readers should seek independent medical advice from their GP or specialist before making any changes to their diet, lifestyle, medications, or medical management based on information presented here.
While reasonable efforts are made to ensure the accuracy of the information provided, medical knowledge evolves and the clinic cannot guarantee that all information is complete, current, or applicable to every individual. To the fullest extent permitted by UK law, the authors and publishers accept no responsibility or liability for any loss, damage, or adverse outcomes arising from reliance on the information contained in this article.
References to specific devices, monitoring technologies, or research findings are provided for informational purposes only and do not constitute endorsement or recommendation for individual use without professional guidance.
- Glucotypes reveal new patterns of glucose dysregulation 2018
- Towards precision medicine in diabetes? A critical review of glucotypes 2011
- BHF Waist measurement tool
- BHF How to measure body fat